Recently, Cennavi (Cennavi for short), a professional big data company under NavInfo, has officially released the 2019 Q1 Traffic Analysis Report. This report's data come from the Cennavi big data analysis platform, NavInfo traffic index platform and China urban road network density monitoring platform. Based on more than 340 cities covered by Cennavi real-time road condition, data returned by 16 million vehicles in real time and data returned by 30 million mobile map APP daily active users, 36 major cities are selected for analysis. The report shows that the overall traffic situation of major cities in the 2019 Q1 is basically the same as that in the same period of 2018.
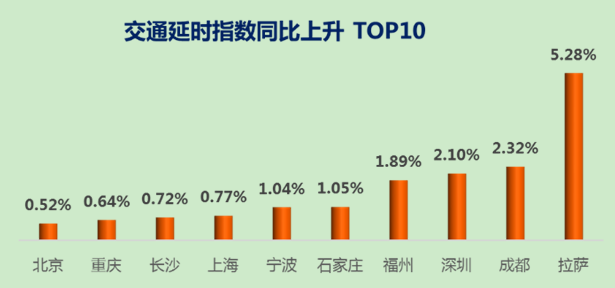
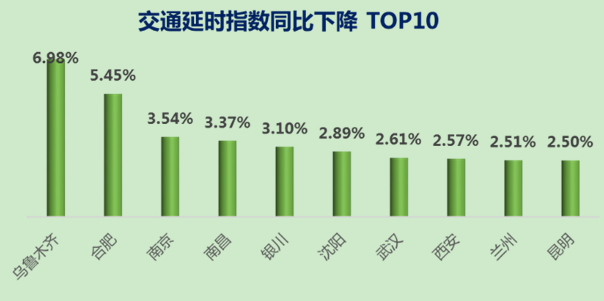
Lhasa ranked the 1st among the Traffic Delay Index Year-on-year Increase Top 10 Cities
Delay index refers to the ratio of actual road transit time to transit time in the free flow (smooth) state. It shows road network congestion from the perspective of time. The larger the index, the lower efficiency of road network operation, the longer the travel time.


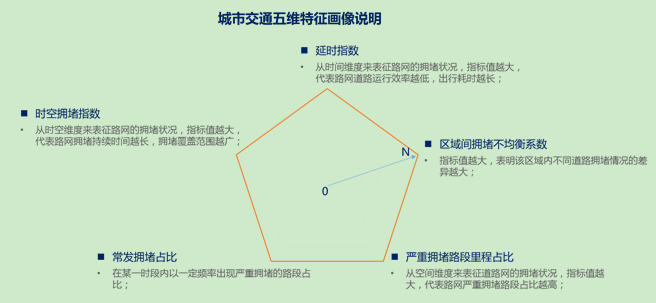
To respond to the "Action Plan on Improving Urban Traffic Etiquette and Ensuring Smooth Urban Traffic" jointly initiated by the Ministry of Public Security, Office of the Spiritual Civilization Development Steering Commission, the Ministry of Housing and Urban-Rural Development and the Ministry of Transport, Cennavi launched the urban traffic congestion five-dimensional portrait for the first time.

It can be seen from the report that among Beijing, Shanghai, Guangzhou, Shenzhen and other first-tier cities, traffic congestion in Beijing is the worst, and the proportion of recurrent congestion is also significantly greater than those of other cities. The overall traffic condition in Shanghai is better than other first-tier cities. The overall traffic condition in Guangzhou is average in the first-tier cities, and different roads vary a little greatly in congestion. The proportion of recurrent congestion in Shenzhen is the lowest among the first-tier cities.